


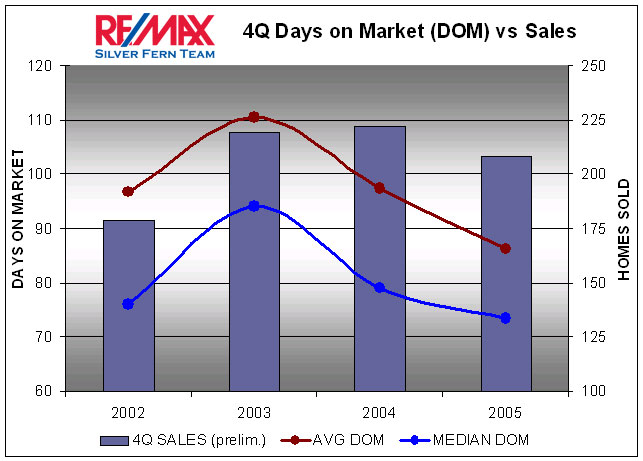
This morning, we're digging further into the numbers on Boulder's market. The chart below depicts the number of homes sold (still preliminary for 4Q05) relative to the days on market (DOM) for the same period. This analysis is for single family home sales, no condos or townhomes relative to average and median DOM. Why both average and median? To illustrate the consistent skew caused by outlying sales.
In plain English, there are a certain number of homes that sit on the market for very long periods of time. If you only look at average numbers, these slow moving properties skew the results significantly.
I'll break down the quarter to monthly results in the next few days as well as revisit the data to see if there have been many updates by realtors. Naturally, monthly data will be more prone to volatility and thus less useful for teasing out longer term trends.
As usual, click on the image below to get a larger view.
----
Like this analysis? Subscribe to our client research report.
Want to get blog updates via email? Click HERE.
Ready to buy or sell? Schedule an appointment or call 303.746.6896.
You can also like our Facebook page or follow us on Twitter.
As always, your referrals are deeply appreciated.
--
The ideas and strategies described in this blog are the opinion of the writer and subject to business, economic, and competitive uncertainties. We strongly recommend conducting rigorous due diligence and obtaining professional advice before buying or selling real estate.
