


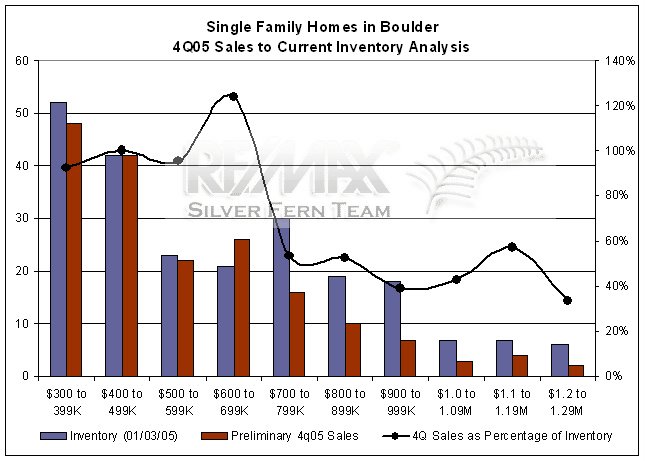
Based on preliminary estimates, Boulder real estate in the 4th quarter of 2005 was a tale of two markets. As the chart below indicates, there was a split between the high and low end of the market. 4Q sales to current inventory was fairly high below $700K, with the highest ratio between $600 and 700K. Meanwhile between $700K and 1.2MM, the ratio was noticeably lower.
What is sales to current inventory? Take the number of homes sold and divide by the current number of homes in inventory. This gives you a rough approximation of the relative performance of the market. I've broken it out by price point and the analysis illustrates a healthy low/middle market and a slower moving high end.
For sellers, the sweet spot was clearly the $600 to $700K tranche in the 4Q. If you happen to be shopping in this price range, be aware that if you see what you really want waiting on the sidelines for Bubble Hoopla to diminish, it may not be a good strategy.
p.s. click on the images/charts to get a better view.
Like this analysis? Subscribe to our client research report.
Want to get blog updates via email? Click HERE.
Ready to buy or sell? Schedule an appointment or call 303.746.6896.
You can also like our Facebook page or follow us on Twitter.
As always, your referrals are deeply appreciated.
--
The ideas and strategies described in this blog are the opinion of the writer and subject to business, economic, and competitive uncertainties. We strongly recommend conducting rigorous due diligence and obtaining professional advice before buying or selling real estate.
